Annexe
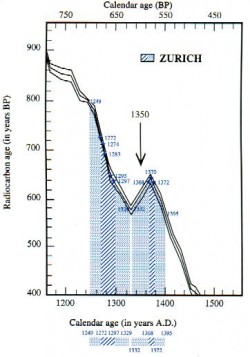
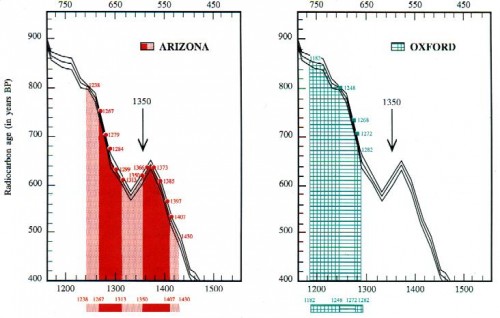
These tables present the results of all the supposedly “ individual ” measurements performed in each of the laboratories. The vertical axis: radiocarbon age, in number of years before 1950 (BP: before present); the horizontal axis: the years corresponding to the calendar or “ calendar age ”, in number of years after Jesus Christ. The conversion of radiocarbon age into calendar age, or “ calibration ”, is provided by the intersection of each of the measurements with a calibration curve established by dendrochronology.
A simple glance at each of these tables indicates why Oxford creates a “ separate band ”, as a straggler of flight no 1:
Oxford provides an average radiocarbon age of 750 years ± 30 years, which corresponds to the 1260-1274 age range with a 68% degree of probability, enlarged to 1229-1280 with a 95% degree of probability. Figure 25 shows the gap between these results and those of Arizona. The whole question is to know whether this gap is normal, statistically, that is to say, whether it corresponds to the Laplace-Gauss law, the classical law of errors performed on large samples, provided the observations are made independently.
To answer this question, not by guess work but scientifically, there exists a test known as x². Applied to the results of the three laboratories for sample 1, it shows that these results come from measurements which are not the effects of one and the same normal law. Therefore, the three samples Al, 01 and Z1 do not form a homogeneous group from a statistical point of view. That is simple mathematics. Especially as when applied to the other samples 2, 3 and 4, the answer given by the x² is positive, with no possible hesitation: samples A2, 02 and Z2 are taken from the same cloth. Likewise for samples 3 and 4. That can be seen with the naked eye on the graphic.